Community gardeners and urban farmers across North America are using an innovative research toolkit developed in New York City to measure and track the impacts of their work. A small group of dedicated gardeners created the toolkit in mid-2013 as part of the Five Borough Farm initiative of the Design Trust for Public Space, a local non-profit incubator for groundbreaking urban planning and design projects. The toolkit is made up of sixteen different methods for collecting data about things like the number of pounds of food harvested in a community garden or the number of children who develop a taste for fresh vegetables after hanging out at a neighborhood farm.
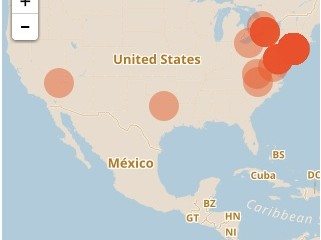
Gardens as far west as Nevada and as far north as Toronto have started using the toolkit and its accompanying online data-tracking site, “The Barn,” since both were released online in mid-2014. The toolkit is freely available for anyone to download, use, and repurpose under Creative Commons licensing. The Barn data-tracking site is also free and open to any community garden or urban farm throughout the world.
The toolkit has already caught on with other gardeners in New York State. 75 community gardens in Buffalo, New York signed up to use The Barn and organizers for the network plan to help gardeners collect data during the 2015 growing season.
“Previously, we existed to set up and support community gardens in our City,” Derek Nichols wrote in a recent email. Derek is the Program Director at Grassroots Gardens of Buffalo, a convener and organizer for the city’s many gardens. “Now, we can focus on capturing the impact of our gardens on things like food access, the environment, and citizen engagement. The toolkit provides an easy guide to attain that data through innovative collection exercises.”
The toolkit is adaptable to different contexts and its creators hope other sites throughout the world will pick it up and reshape it to meet their local needs.
There is plenty of academic research on the benefits of gardening and farming in cities. Some studies suggest that gardens and farms create access to fresh and healthy produce in areas with few grocery stores or markets, promote biodiversity and create vibrant habitats for non-human species, and foster the development of tight-knit communities empowered to participate in local democratic processes.
Farmers and gardeners in New York City developed the toolkit to take this kind of research into their own hands, allowing them to ask—and, hopefully, answer—questions directly relevant to the day-to-day activities at their own farms and gardens. The toolkit invites users to set goals for various gardening and farming practices and then track their successes and failures over time. Users can reflect on their data at the end of a growing season and strategize ways to improve their practices for the year ahead.
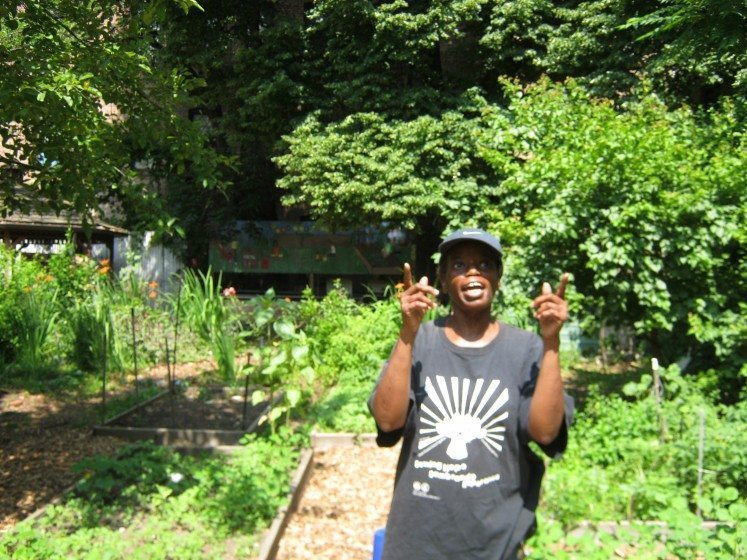
The data can also be useful for supporting and expanding community gardens and urban farms in cities where vacant lots are rapidly disappearing under waves of gentrifying redevelopment. Gardeners and farmers can use the data to demonstrate the social, economic, and environmental value of setting aside patches of the urban landscape for something other than concrete, glass, and steel.
The toolkit is broken up into five sections: 1) food production data; 2) environmental data; 3) social data; 4) health data; and 5) economic data. Each section contains step-by-step instructions for collecting data using methods that are cheaply and easily replicated at any farm or garden. For example, gardeners that want to track the pounds of local household garbage they divert from landfills simply need a five-gallon pail, a no-frills kitchen scale, and a clipboard to methodically weigh and record all of the banana peels, apple cores, and woodchips that get tossed into their compost bins.
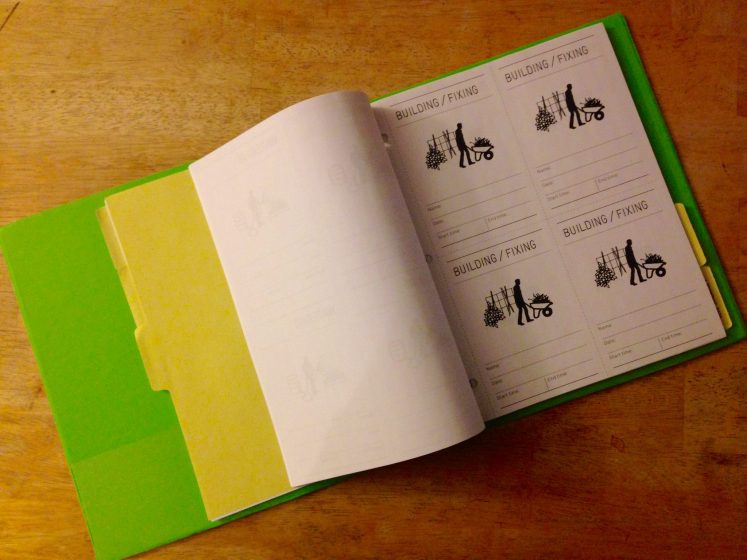
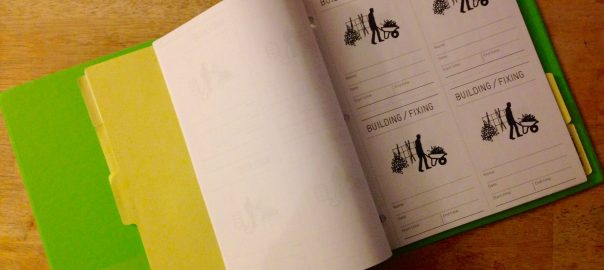
Some of the social data collection methods in the toolkit build on age-old community organizing techniques, while others were specifically designed with the needs of volunteer-run gardens and farms in mind. One method in this category invites gardeners to take stock of all the latent skills and knowledge waiting to be tapped within a gardening community, using a standard asset-mapping approach with sticky notes and flip charts posted around a conference room. Another method provides garden leaders with illustrated “Task Cards” that allow volunteers to create a paper trail for all of the labor hours they donate over the course of a season.
One of the health data tracking methods looks at whether children who spend time at a garden or farm develop an affinity for eating fresh vegetables. The method asks children to log whether they think the taste of a particular vegetable grown at the garden is “yum” or “yuck”—both before and after tasting the vegetable for the first time. Here’s an illustration of how the method works, taken directly from the toolkit:
Jeanine is a Children’s Workshop Leader at the little community garden in Memorial Park. Every summer, she works with fifth graders from a local summer day camp to plant rows of corn, green beans, and tomatoes. The children harvest the crops as they ripen throughout the season, tasting each harvest and bringing some of the produce home with them in little paper bags. The children always have a lot to say about what they’ve tasted, but Jeanine struggles to keep track of how their attitudes change as a result of growing and tasting the vegetables for themselves.
Last year, as the green beans and tomatoes started to ripen and harvest time approached, Jeanine got ready to track what the children thought about the taste of these two vegetables. She took two large tin cans out of her recycling bin, cleaned them, and taped a colorful drawing onto the front of each can: one of a big red tomato, the other of a bushel of green beans. She bought a bag of dry red beans and a bag of white beans at her local grocery, and poured each bag into separate bowls.
The next morning, Jeanine arranged the bowls and the jars on a picnic bench in the garden. After the children arrived and got settled, Jeanine briefly taught them how to harvest the tomatoes and green beans. She then invited each one to step up to the picnic bench and pick a “Yum” bean or a “Yuck” bean to describe what they thought about tomatoes—a red bean for “Yum” and a white bean for “Yuck”. Their choice made, they dropped their bean into the tin can labeled with the drawing of a tomato and then did the same thing again for the green beans.
While the children worked in the garden with Jeanine, another adult gardener poured the contents of each jar into separate plastic bags and set them aside for Jeanine to count out later. After the harvest was over, everyone tasted a tomato and a green bean—some for the first time. Jeanine then invited the children to step up to the picnic bench once more and register how they felt about tomatoes and green beans after harvesting and tasting them. When the children left for the day, Jeanine counted out the red beans and white beans in each of the plastic bags and compared them to the beans left in the jars. She found that there was an increase in “yum” opinions about tomatoes by the end of the day, and a small in- crease in “yuck” opinions about green beans. She logged the results and shared them with other gardeners and began thinking about other ways to make the next harvest more appealing to children in the garden.
The toolkit builds on earlier work done by the Farming Concrete initiative to help community gardeners and urban farmers weigh and keep track of all the pounds of food they grow each season. Farming Concrete’s protocols for measuring both the number of crops cultivated and the number of pounds of food grown are the first two methods found in the pages of the toolkit. The Farming Concrete team became partners in the Five Borough Farm initiative, and now the toolkit and its accompanying data logging technology are hosted on the Farming Concrete website.
The toolkit contains handy data worksheets that are easy to photocopy and reuse from month to month and season to season. Gardeners and farmers can also gather and analyze their data at “The Barn” after they set up a user account and create a site record for their urban farm or community garden. The system generates stylish summary reports with charts and graphs that are easy to print, email, and share with other gardeners, with policymakers, and with potential funders.
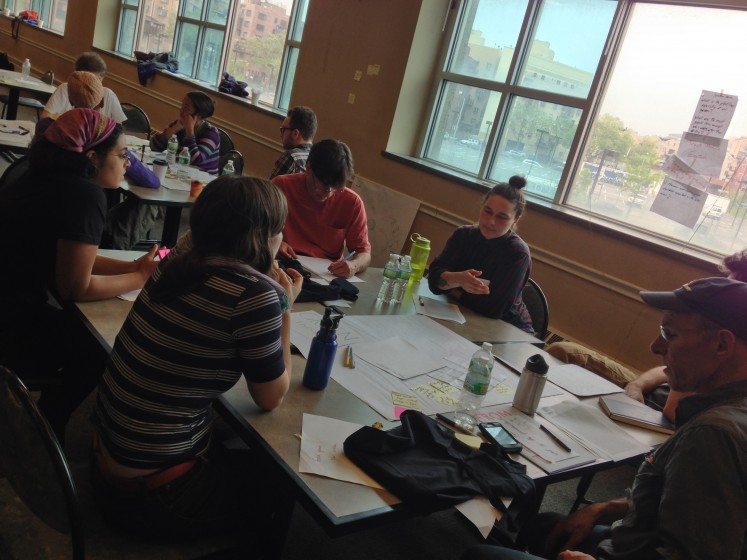
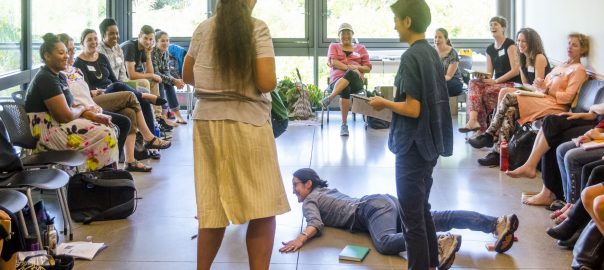
A group of thirty gardeners and farmers came together in the late spring of 2013 to craft the toolkit with help from two Outreach Fellows sponsored by the Design Trust. The Outreach Fellows facilitated a daylong brainstorming workshop where gardeners and farmers laid down the first core set of ideas that would evolve into the first version of the toolkit. The session followed the precepts of “Open Space Technology”, empowering participants to form their own small working groups based on their own interests, passions, and concerns.
A report published by the Design Trust for Public Space had this to say about the approach:
Groups formed, split, grew, and shrank during the workshop, while creatively tackling the same basic question—“How do we know something good is actually happening in our garden?” At the end of the workshop the full group reassembled to share sketches of a dozen new methods that were both meaningful to them and achievable, based on the capacities of their fellow gardeners.
The Outreach Fellows worked with gardeners and farmers across the city to pilot and test the toolkit throughout the summer of 2013. The feedback they received during the subsequent fall and winter led to the development of an updated version of the toolkit released in 2014. A new team of Outreach Fellows is currently working to adapt the toolkit based on additional feedback from farmers and gardeners provided during the 2014 growing season. The updated toolkit will be available for free download in the spring of 2015.
Philip Silva
New York
***
The author served as a Five Borough Farm Outreach Fellow along with his collaborator Liz Barry from September 2012 to December 2014. The current Five Borough Farm Outreach Fellows are Sheryll Durant and D Rooney. The author continues to serve as a special advisor on the project.


Leave a Reply