The year 2014 seemed a long year when it came a year ago but passed by very quickly giving way to another long New Year and fresh hope that the world would be prosperous. What does it mean for all the countries in the world to be Prosperous? It requires creating a successful, flourishing or thriving conditions to be well-off?
At the beginning of 2000, the world leaders identified the most pressing development challenges and took a pledge to strive towards these eight goals, popularly called Millennium Development Goals by 2015. The MDGs—with eight goals, 21 sub-goals monitored through 60 indicators—established a blueprint for a better tomorrow. Thus, this year, 2015, is an important milestone and we have just a year ahead of us to achieve the MDGs. Already the world is geared towards post-2015 development agenda. To quote Ban Ki-Moon, Secretary General of United Nations: “Efforts to achieve the MDGs are a critical building block towards establishing a stable foundation for setting sustainable development goals beyond 2015”.
It is time to take stock of what has been achieved so far in our goal of making a better tomorrow. A key question is this: can all of these goals be achieved, or are their trade-offs?
An examination of the data suggests that we gain in some areas of the five capitals—natural, human, social, financial, and manufactured—at the expense of others.
The table below lists the MDG goals and the achievement so far, as per the Millennium Development Report 2014. In sum, work on the time-bound targets has yielded results far off the mark.
Goal |
Achievement so far, as per the Millennium Development Report 2014 |
|
| 1 | Reduce poverty and hunger | • The extreme poverty rate has been halved, but major challenges remain
• Limited improvement in job quality is accompanied by slowdown in productivity growth • Hunger continues to decline, but major efforts are needed to achieve the hunger target globally by 2015 |
| 2 | Achieve universal primary education | • Despite impressive strides forward at the start of the decade, progress in reducing the number of children out of school has slackened considerably |
| 3 | Promote gender equity and empower women | • Gender disparities are more prevalent at higher levels of education |
| 4 | Reduce by two thirds, between 1990 and 2005, the under-five mortality rate | • Despite substantial progress, the world is still falling short of the MDG child mortality target |
| 5 | Improve maternal health | • Much more still needs to be done to reduce maternal mortality. |
| 6 | Combat HIV/AIDS, malaria and other diseases | • There are still too many cases of HIV infection• Have halted growth by 2015 and begun to reverse the incidence of malaria and other major diseases; the world is on track to achieving the malaria target, but great challenges remain |
| 7 | Achieve environmental sustainability | • Millions of hectares of forest are lost every year
• Global greenhouse gases continue their upward trend• Renewable water resources are becoming more and more scarce • Many species are driven closer to extinction• The number of people living in slum conditions has been growing |
| 8 | Develop a global partnership for development | • Official development assistance is now at its highest level, reversing the decline of the previous two years |
What do these millennium goals mean for the overall well-being?
Based on the achievement of targets, can the nations judge whether they are sustainable?
Should income, as measured by the Gross National Product, be the sole criteria for prosperity or are some other indicators important also?
“Income alone is insufficient”
This argument has been promoted since 1990s through one such effort, the human development indicator created by UNDP: the Human Development Index (HDI). HDI emphasizes that each country’s capability should be the ultimate indicator for assessing and comparing development in different countries. Thus the HDI is the geometric means of normalized indices for standard of living (as measured by gross national income), health (measured by life expectancy at birth) and educational attainment (measured by the mean years of schooling for adults aged 25 years and above and expected years of schooling for children entering the school). The index is limited in the sense that it does not consider other important issues like inequality, poverty, empowerment, etc, which however, were used in other HDI versions. HDI should be seen as the maximum attainable level when all the nations are similar and all nationals have similar levels of inequality, poverty, empowerment, etc.
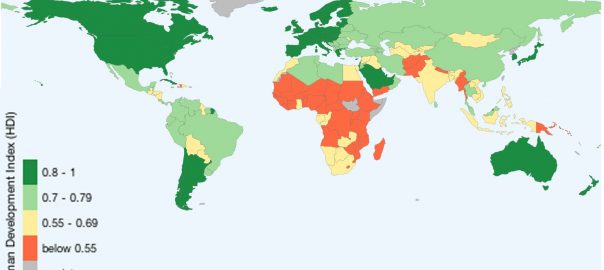
The good news is that since 2000 all the nations have improved their human development index as per the different Human Development reports. This is clearly a good sign but countries vary significantly. The figure below shows HDI in different countries, based on the Human Development Report (2014). It is obvious from the figure that countries with higher levels of income have higher HGI.
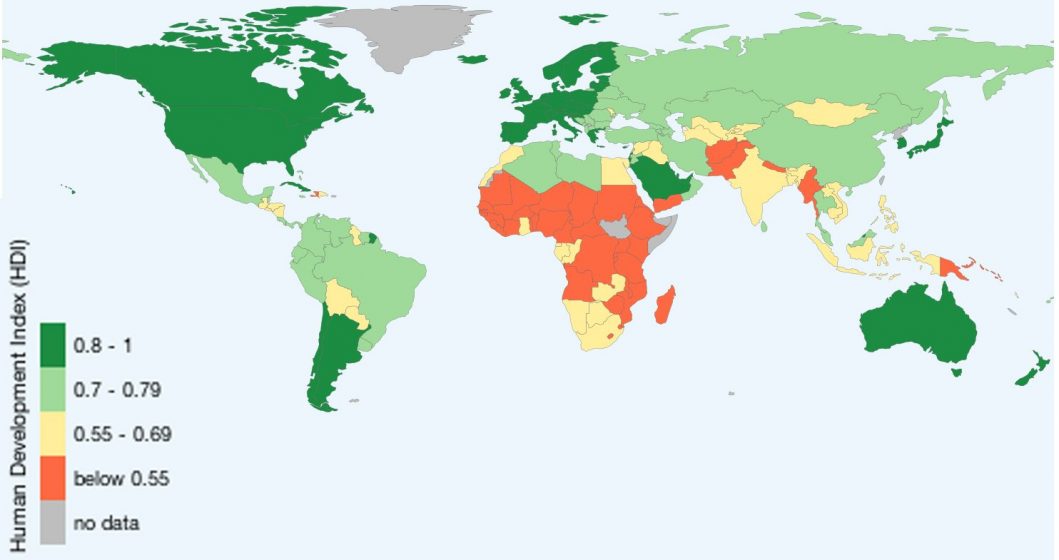
HDI has parallels with the Millennium Development Goals, above. Goals 1, 2 and 4 of MDGS can be evaluated through HDI. However, HDI falls short as a measure of other goals. The MDGs are balanced on five pillars: the nations standard of living (Goal 1), health capital (Goals 4, 5 and 6), human capital ( Goal 2), natural capital (Goal 7) and social capital (goal 8 and goal 3). HDI, of course, falls short on measuring natural capital, but other indices are available to measure the progress and prosperity of the nations.
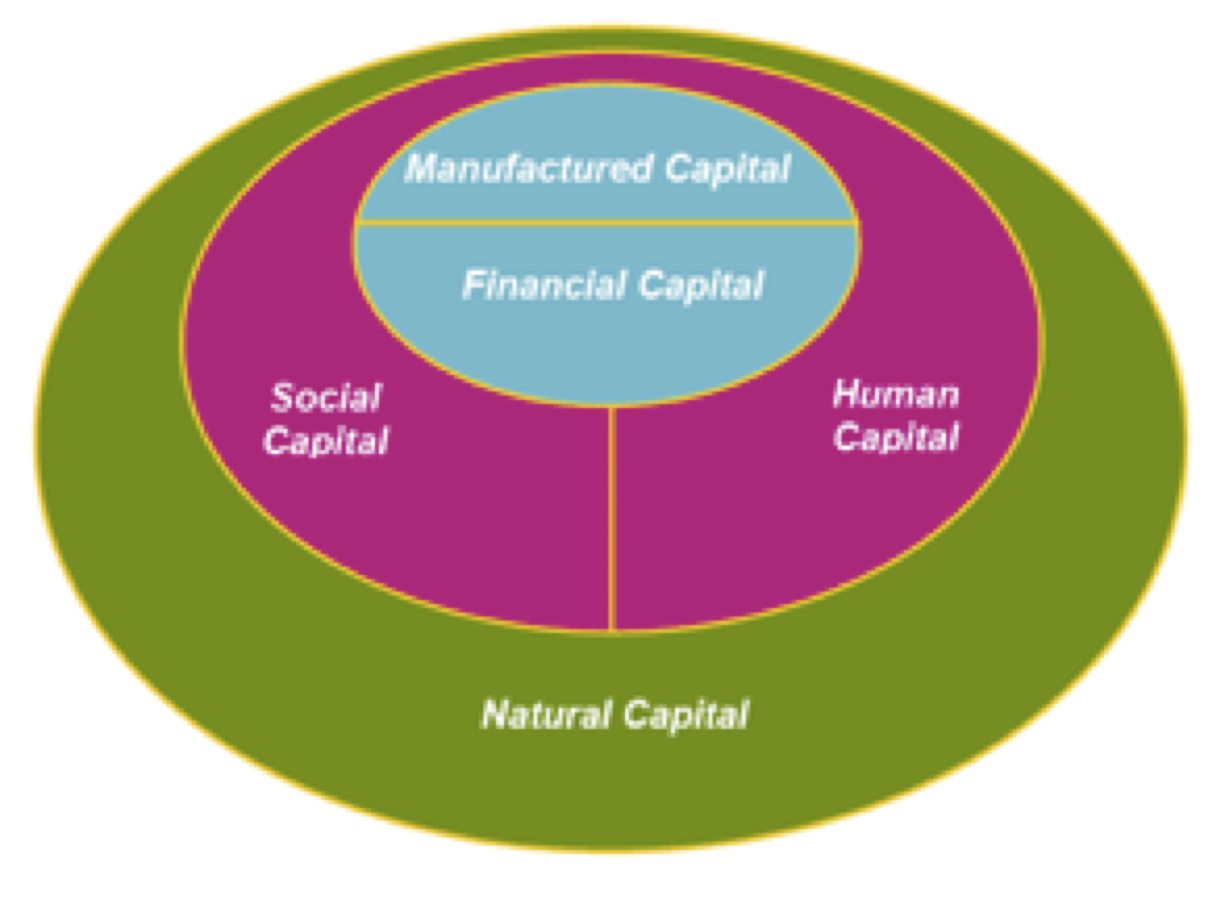
The UNU-IHDP and UNEP initiative on the Inclusive Wealth Report (IWR) fills this gap in measuring other forms of capital. Inclusive wealth is the measure of productive capital base of the economy. The Inclusive Wealth Index (IWI) was created to reflect a bigger picture of a country’s wealth in terms of progress, well-being and long term sustainability.
The index complements GDP by introducing the impact and value of ‘Inclusive Wealth’: Natural Capital, Human Capital, and Produced Capital. IWI measures the wealth of nations by carrying out a comprehensive analysis of a country’s productive base. That is, it measures all of the assets from which human well-being is derived, including manufactured, human and natural capital. In this, it measures a nation’s capacity to create and maintain human well-being over time.
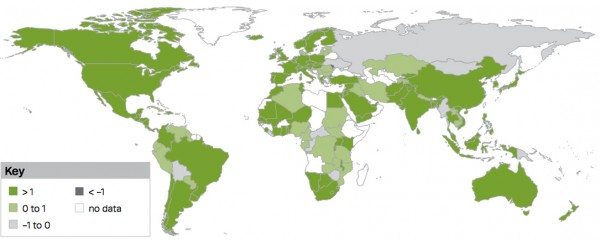
IWI shows (above) that around 91% of countries for which the data is available experienced a positive annual average growth rate in wealth during the period 1990 to 2010, while the remaining countries exhibited a negative growth. However, if one takes population growth into consideration (i.e. the proportion of the pie that each person gets over a period of time), only 60% of the countries experienced positive growth rates while the rest experienced negative growth rate.
The key reason why inclusive wealth has increased is because (1) in 137 of the 140 countries considered by the IWR (2014) there was an increase in human capital during the period 1990 to 2010 and (2) and increase in produced capital in 132 of the 140 countries. Thus, IWI shows how well the MDG targets are reached but also shows the conflict: to achieve certain targets the natural capital has to be compromised (Target 7). The IWR analysis shows that natural capital has experienced positive growth in only 24 of the 140 countries.
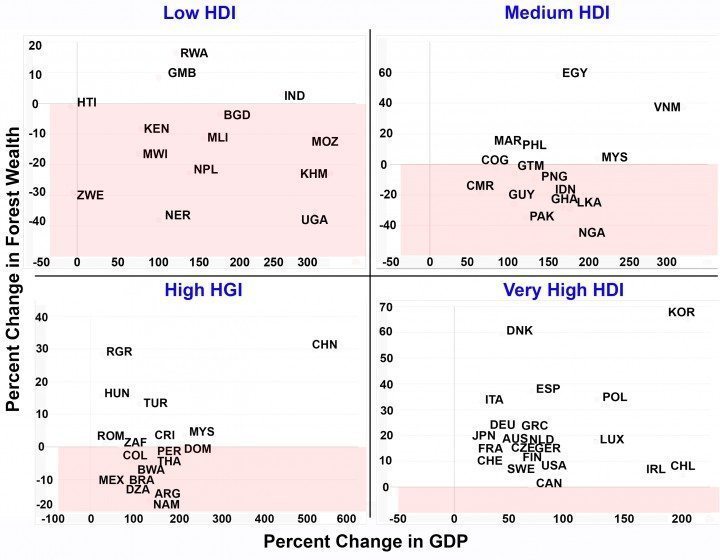
The Millennium Development Goal 7 is “Achieving environmental sustainability”. The analysis of forest wealth of nations in IWR (2014) shows that most of the countries with low and medium HDI are liquidating their forest capital in the process of increasing their income to provide better job opportunities and income earning opportunities for their population. While the total GDP of the nations chosen in the study grew by 69% between 1990 and 2010, low and middle income countries experienced relatively higher growth, with GDP growth ranging between 20 and 66 percent.
Though the human capital has improved, this growth, however, has come with a trade-off in precious forest capital. With the exceptions of Rwanda and Gambia, the low-income countries depleted forest wealth while experiencing positive GDP growth. Haiti experienced a decline in GDP while increasing forest wealth. Zimbabwe experienced declines in both GDP growth as well as forest wealth. The middle-income countries showed a mixed trend. India and China managed to be on the positive growth path while increasing their forest wealth, whereas Brazil and Indonesia are losing their rich forest capital.
Most of the lower middle-income countries are growing at the expense of forest wealth. All the high-income countries in the sample have stabilized their forest wealth.
The illustration suggests that it may not be possible to achieve all MDGs simultaneously.
What is the role of our urban community? It is clear that urbanisation has a major influence on determining the growth of the nations as well as the quality of the environment. As the pressure on land increases for habitation, infrastructure development and industrialisation increases, natural capital will be at risk.
Sustainable development requires integration of all the five capitals together. It is important to create jobs, provide income earning opportunities and food security, reduce inequalities, improve the standard of living, and improve the human capital health capital but at the same time conserve natural capital.
How we do this is a big open challenge for our urban community. This is what makes countries prosperous. Can we hope that 2015 will prove to be an important year in improving our prosperity?
Haripriya Gundimeda
Mumbai
***
References:




2 Comments
Join our conversation